The investing axiom, “the stock pays a good dividend,” is about as old and seasoned as my grandfather’s La-Z-Boy recliner1. Whether you are a casual investor, or someone who is steeped in the mechanics and fundamentals of investment analysis, you have most likely heard (multiple times) that phrase used in conjunction with a reason to invest in a stock.
Using the dividend amount (size) or the percentage yield as the sole justification for owning a stock, exchange-traded fund (ETF), mutual fund, or investment strategy is misguided at best, and at its worst, can cause significant opportunity cost to an investor. In this article, I am going to illustrate some of the misconceptions regarding pure dividend investing, and why using it as the sole underpinning of an investment thesis can lead to sub-optimal outcomes. I’ll also discuss how using dividends as a component of a broader investment strategy can be a tailwind for asset allocations and investors.
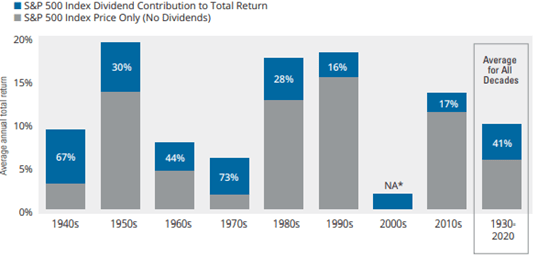
A common refrain, especially among those who’s peak earning power came of age and/or largest influences were adjacent to the 40s, 50s, 60s, and 70s, is that a good dividend equates to a good company/stock. This makes sense, as a common way publicly-listed companies compensated their equity holders during the 1940-1979 time period was through consistent and steadily increasing dividends. Investors were conditioned to focus on dividends and not total return.2 The chart below3, generated by the folks over at Wellington Management and Hartford Funds earlier this year, details the percentage return contribution of dividends (blue bar) relative to the overall return of the S&P 500. With dividends contributing 67% and 73% of total performance in the S&P 500 in the 1940s and 1970s respectively (with 30% in the 1950s and 44% in the 1960s for good measure!), it is easy to see how investors can become “anchored” in the belief that dividends are an essential ingredient in making a stock “good.”
Like most things in life, the markets and publicly-listed companies have evolved in how they compensate and create wealth for their stakeholders. As the chart above shows, a decline in the contribution in dividends as a percentage of the S&P 500 total return began in the 1980s, and has remained well below the levels seen in the 1940-1979 period.4 In particular, the concept of share buybacks and shareholder yield5 (% dividend yield + % change of net share buybacks) began to gain traction. For taxable investors, the concept of a company buying back stock in the open market (thereby increasing an investor’s share of earnings and ownership of the company) was a more palatable and capital-efficient compensation tool than receiving a dividend that would be taxed at the federal, state6, and local levels.7 Whether share buybacks are a net positive for investors is a subject much too intense for this writing; for those interested, I recommend reading a white paper by AQR’s Cliff Asness, Scott Richardson, and Todd Hazelkorn that is linked in the footnotes below. 8
In many cases, using a “dividend-only” filter omits several key components: 1) How is the company paying for its dividend, via free cash flow or through debt financing? 2) Would investors be better off in the long run if the company eschewed paying a dividend and/or growing its dividend in favor of reinvesting these funds in its business? 3) Should a company strategically and/or tactically reduce their share count, thereby increasing the ownership percentage of stakeholders in a more tax-efficient manner?
As companies began to focus on shareholder yield (or total return more broadly, e.g., reinvesting cash flows into research and development, acquisitions, paying down debt), investors who pursued an investment strategy solely focused on stocks that paid a “good” or “big” dividend did so at a significant opportunity cost to their portfolios and their overall wealth. Consider the last ten years, which have encapsulated one of the longest and largest bull markets in domestic equities ever (and the largest of the last 30+ years); the S&P 500 ETF (symbol: SPY) had an annualized return of +14.7% vs. +12.3% for the Vanguard High Dividend Yield ETF (symbol: VYM), an annualized outperformance of +2.4%.9 Whether you are a young investor with a long time horizon or an investor that is near retirement, missing out on 2.4% compounded annually over ten years represents a significant risk to the accumulation of wealth over time.
While deploying a “dividend-only” investment filter can lead to significant opportunity cost and investment concentration (no exposure to low or no dividend payers like Amazon, Facebook, Microsoft, Apple), utilizing dividends as a component of an investment philosophy/strategy can be a tailwind for asset allocations and investors.
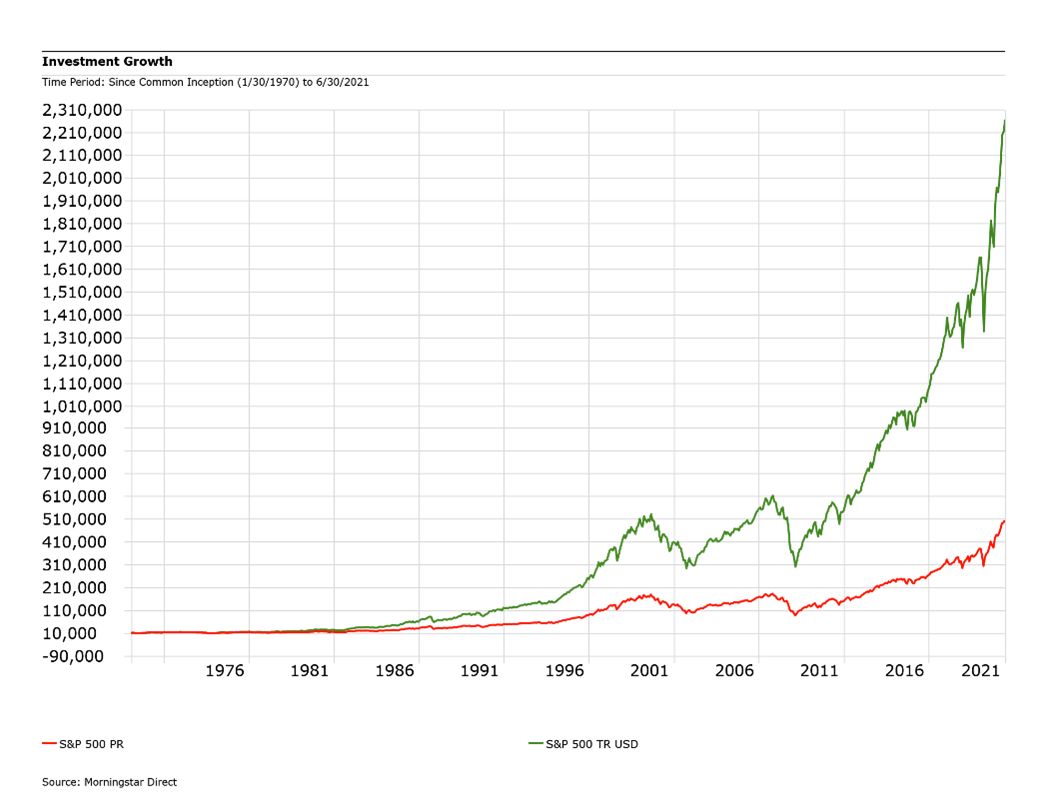
The chart below shows the power of reinvesting dividends (and compounding capital) in the S&P 500 versus an investor just receiving the price return (appreciation). A $100,000 investment in the S&P 500 with dividends reinvested (green line) on January 1, 1970, turned into $2,268,947 as of June 30th of this year; the same $100,000 investment in the S&P 500 receiving just the price return (red line) turned into $505,469 as of June 30th, a difference of $1,763,478.10 The power of compounding, and the incremental additional yield generated by dividends that are reinvested, create a powerful flywheel effect on the initial capital.
Diversification is the only free lunch in investing, and investors have been rewarded over time by deploying portfolios that were not concentrated in any one strategy. There was a time when dividends represented a significant source of investment return for investors. However, investment markets are never static, and as companies have changed the way they compensate stakeholders, prudent investors and investment advisors need to approach markets and stocks with flexibility that meets the current market paradigm. Dividends as a component to a broader investment strategy can be a powerful wealth accumulation tool (as evidenced in the chart above) but used as the sole investment filter/strategy, can lead to underperformance and significant opportunity cost for investors.
If you have questions or would like to discuss this topic further, please reach out to a Schneider Downs Wealth Management Advisor. We welcome a conversation with you.
Schneider Downs Wealth Management Advisors, LP (SDWMA) is a registered investment adviser with the U.S. Securities and Exchange Commission (SEC). SDWMA provides fee-based investment management services and financial planning services, along with fee-based retirement advisory and consulting services. Material discussed is meant for informational purposes only, and it is not to be construed as investment, tax or legal advice. Please note that individual situations can vary. Therefore, this information should be relied upon when coordinated with individual professional advice. Registration with the SEC does not imply any level of skill or training.
1 My grandfather, John Patric Lucrezi, was a proud 1st generation Italian American, who joined the Army at 17 and served during WW II, was a lead pipefitter at the Diamond Shamrock, and drove an 18-wheel truck after the Diamond Shamrock went bankrupt. He loved his family, an ice-cold Pabst Blue Ribbon beer, and his beloved La-Z-Boy recliner that NO ONE was allowed to sit in but him. EVER. Miss you Pops!
2 Total Return = Price Appreciation + Dividends
3 https://www.hartfordfunds.com/dam/en/docs/pub/whitepapers/WP106.pdf
4 Save for the 2000-2009 time period where the dividend made up all of the return as the Dot-Com bubble bursting combined with September 11th and the fallout from the Great Financial Crisis, led to a negative annualized price return in the S&P 500 point to point.
5 https://osam.com/Commentary/shareholder-yield-a-differentiated-approach-to-an-efficient-market
6 There are some states that do not have a state income tax, Florida, Texas, and Washington State most prominently.
7 Share buybacks are currently NOT TAXED, but there have been several proposals by Democratic lawmakers to create some mechanism to tax these transactions. None of the proposals appear to have traction as of this writing.
8 https://www.aqr.com/Insights/Research/Journal-Article/Buyback-Derangement-Syndrome
9 Calculations were done using Morningstar Direct.
10 Calculations done using Morningstar Direct from 1/1/1970 through 6/30/2021 using the S&P 500 total return in US Dollars and the S&P 500 price return in US Dollars.


