Natural gas rig count is often viewed as an indicator of future gas production. An increase in rigs leads to an increase in the amount of wells from which gas can be extracted, which in turn drives up the possible upper limit of production. Rig count can also be seen as an indicator of where companies are choosing to invest their capital, as an increase in the amount of rigs in a particular region may suggest a focus by industry leadership on that area. Finally, the count is frequently indicative of the market for these resources as a whole. An increase in the price of these goods makes the industry more profitable and allows for increased drilling.
Baker Hughes, one of the world’s largest oil field services companies, publishes a weekly analysis of rig counts in North America. The aggregated data is presented as a combined figure representing both oil and gas rigs. Baker Hughes also releases the weekly source data for their calculations, which includes details such as the country, type (oil or gas), and specific geographic location of each rig. Using this data, Schneider Downs was able to perform an analysis on natural gas rig count by basin, as well as an oil rig analysis provided later in this article.
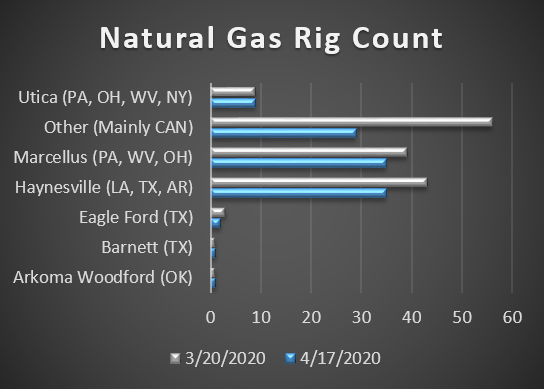
For the four week period from March 20, 2020 to April 17, 2020, the Marcellus Shale basin (PA, WV, OH) saw its rig count decreased from 39 to 35, a 10% drop. The Haynesville Shale (LA, TX, AR) saw its count dip from 43 to 38, or 19%. The Arkoma Woodford (OK), Barnett (TX), and Utica (PA, OH, WV, NY) basins all saw no variance in count, remaining at one, one, and nine rigs, respectively. The Eagle Ford basin (TX) saw a decrease from three rigs to two. The largest drop, however, came in the region designated as “Other” by Baker Hughes. This consists mainly of rigs stationed in the Foothills Front of Canada and Northern British Columbia. These areas saw a drop from 56 rigs to 29, a 27% decrease. The chart below visualizes these changes.
The energy sector has experienced high volatility recently, with oil prices falling to historic lows. As domestic and global social distancing efforts have dramatically reduced the amount of travel done by the average consumer, the demand for oil has correspondingly decreased.
Further intensifying the situation was a refusal by Russia to reduce oil production in unison with the other member nations of OPEC. The decrease in production of oil by the major oil producing countries was intended to stabilize the price of the commodity. However, after Russia backed away from the agreement, Saudi Arabia took measures to begin a price war, which in turn sparked an even larger drop in oil prices internationally. In mid-April, the price of West Texas Intermediate oil futures fell below zero for the first time in history. The prediction by many experts is that production will be cut by natural gas producers, as has already been done by oil producers, in order to keep the price of gas from dropping further.
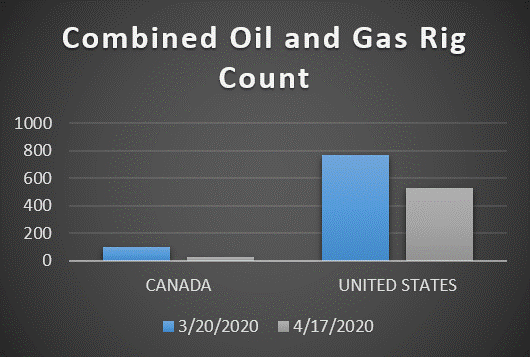
The data from Baker Hughes shows that total rig count for Oil and Gas have fallen during the period of March 20 to April 17 from 98 to 30 in Canada, and from 772 to 529 in the United States. However, some believe this decrease in the production of energy is a positive sign for the natural gas industry.
According to Goldman Sachs analyst Samantha Dart, depressed gas prices over the previous few years have been driven mainly by the overproduction of gas, leading to a saturation of the market compared to demand. When oil is drilled for in states like Texas, which also sits on large natural gas deposits, gas is often collected simultaneously with the oil, termed “associated gas”. The supply of associated gas will drop in line with the decrease in oil production, and so the overall natural gas supply should decrease as oil drilling falls. Samantha believes that this will lead to an increase in price, helping to drive growth in the industry.
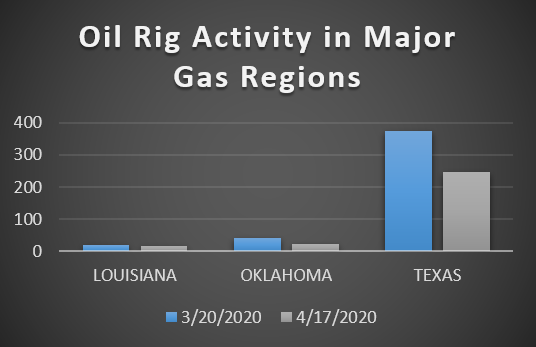
The chart above shows recent variances in the count of oil rigs in states that also lie on major gas deposits, and so produce the previously mentioned associated gas. Louisiana’s rig count fell from 18 to 16, Oklahoma’s count fell from 42 to 23, and Texas’ count dropped from 373 to 246 during this period. While time will tell how the recent economic uncertainty will influence the oil and gas industries long-term, as of now rig counts have fallen across the board.
To see additional information and the source data used by Schneider Downs to create the charts above, visit https://rigcount.bakerhughes.com/rig-count-overview.
Sources
Related Posts
No related posts.


