During this unprecedented time, navigating the uncertainty of the upcoming semesters for higher education institutions is essential for student, faculty and staff safety, but it is also crucial for an institution’s reputation and short and long-term financial health. A 2017 study by the National Center for Education Statistics (NCES) showed, on average, instruction cost represents the highest or second highest expenditure for an institution.

Whether it represents the highest or one of the highest expenditures at your institution, when was the last time you looked at the effectiveness of that expenditure? Are full-time and part-time instructors teaching the amount of credits their contract or the faculty handbook dictates? Have your course offerings been analyzed to see if they meet the demands of your current enrollments? Analyzing the workload of your instructors to the expectation set in contracts or the faculty handbook will show which instructors are underperforming or over performing. This analysis will help you make informed decisions about staffing levels based on the historical performance of current staff. Summarizing this analysis by school or department will identify which areas need more staff and which areas are overstaffed.
While the workload of instructors will identify their performance, an analysis of course offerings will help identify adequate staffing levels needed. Taking a deep dive into the courses offered each academic year, focusing on the percent of seats filled for the course, would analyze whether offering a course multiple times is necessary. In order to assess whether a course needs to be offered multiple times a semester or in an academic year, the course enrollment must be compared to the maximum enrollment set for registration. With visualization applications, such as Tableau or Power BI, it is easy to identify courses with consistently low enrollment. In the example below, each course is represented by a data point (circle) with the average fill rate (course enrollment/maximum course enrollment) being the Y-axis, and the number of times the course is offered being the X-axis. The color legend helps to easily identify lower-level courses, as these courses tend to be offered more frequently.
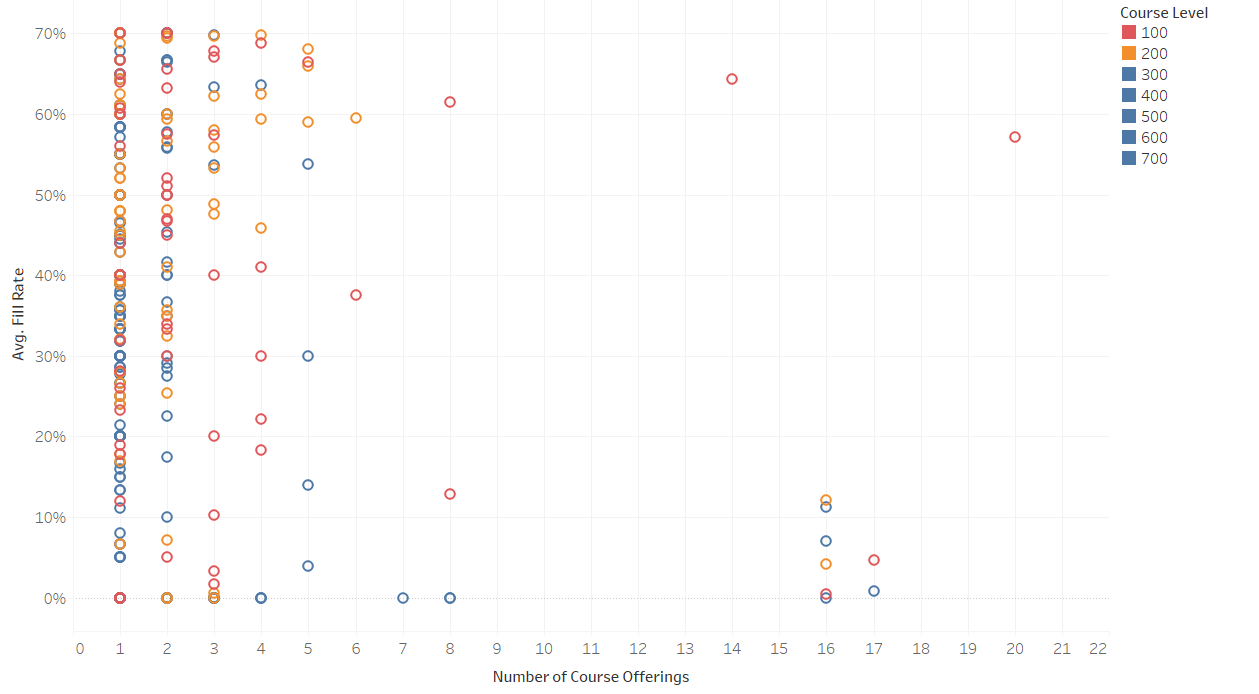
The graph above focuses your attention on the bottom-right corner where the average enrollment is below 20%, and the courses are offered 16 times or more. However, the left side of the graph should not be ignored. Understanding why a course is offered six times with an average enrollment below 40% should be investigated.
Doing this analysis could provide insights into how to plan for future semesters, which in conjunction with the instructor workload analysis will assess the effectiveness of the expenditure. Another consideration when planning the course offerings for future semesters is analyzing students within each degree and the courses required to graduate for that degree. Comparing how many students have completed a specific course for a degree compared to the number of students who have yet to complete it will enable you to better plan the number of times to offer a course.
The predictive analytic and the visual above can be customized to help fit your institution’s needs and concerns. Need help assessing the effectiveness of your institution’s expenditures on instruction or utilizing analytics to make informed decisions? Ask how Schneider Downs can help analyze your instructor workload, low-enrolled course optimization, course offering predictor and more.