Having financial freedom means doing the things you want to do when you want to do them without having to question if you have the available finances.
The roadmap to successfully reaching financial freedom begins with creating a sound financial plan, yet a recent study shows that only 30% of U.S. households have a long-term financial plan in place (fortunly.com).
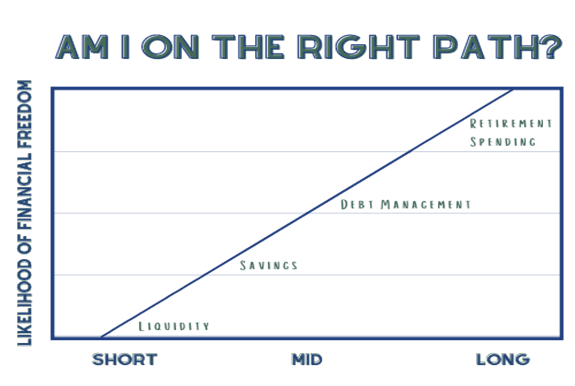
Basic financial ratios are the building blocks of creating a successful financial plan. If you want to accomplish financial freedom faster, try using these four ratios: liquidity, savings, debt management, and withdrawal rate.
Liquidity – How much cash should you have available?
Liquidity Ratio – Cash or Cash Equivalents / Monthly Expenses
Ex. If you have a total of $12,000 in cash and your monthly expenses are $4,000, your Liquidity Ratio would equal 3 months of expense coverage.
The Liquidity Ratio ensures that you have enough cash available for your expenses and the ability to navigate through any unforeseen financial circumstances with limited stress.
The rule of thumb is to include 3 to 6 months of expenses when calculating this ratio. Typically, if you have multiple sources of income, you can stay closer to 3 months of expense coverage, but if you only have one source of income it would be better to stay closer to 6 months.
In order to determine your Liquidity Ratio, start by gathering data on your living expenses and your total cash or cash equivalents (i.e., checking accounts, CDs, savings accounts, and cash on hand). Then, create a budget worksheet based on your bank account activity to determine your monthly expenses.
After calculating your ratio, if you have less than three months of expense coverage, you should increase the amount of cash you have. On the flip side, if you have more than six months of expense coverage, you can consider investing that cash into other types of securities (i.e., stocks, fixed income, or other).
Savings – Are you saving enough each month?
Savings Ratio – Monthly Savings / Monthly Gross Income
Ex. If you are saving $1,200 per month and your monthly gross income is $6,000, your Savings Ratio would be 20%.
People are often surprised to hear that attaining financial freedom has more to do with how much you save vs. how much you earn. Knowing how much to save is never an easy question to answer, but the financial rule of thumb is the 50/30/20 rule which allocates 50% of your cash flow to your essential needs, 30% to your non-essential spending, and the remaining 20% for saving or paying down debt. Of course, if you can save more than 20%, you will be better positioned to achieve financial freedom sooner rather than later. To learn more about the 50/30/20 rule, please visit Your Guide To The 50 30 20 Budgeting Rule – Forbes Advisor.
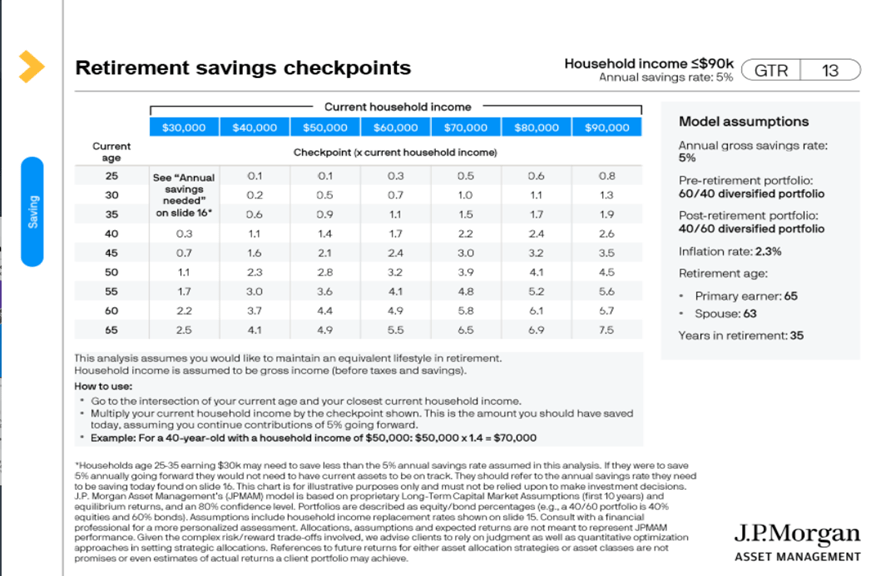
Are you curious how your savings compare to those in your income and age brackets? Take a look at the below chart to see how much J.P. Morgan recommends you have saved at your current stage of life.
Debt Management – How much debt can you have?
Debt Servicing Ratio – Total Monthly Debt Repayments / Monthly Net Income
Ex. If you are paying a total of $2,100 per month in debt repayments and your monthly net income is $6,000, your Debt Servicing Ratio would be 35%.
Debt typically arises for people when purchasing a home or car, through student loan debt, or credit card spending; but how much debt is too much? Debt management is more important than ever. According to Kasasa, almost half of the American population is carrying credit card debt totaling $807 billion with an average interest rate around 16%.
When assessing your Debt Management Ratio, your goal should be 35% or less and it is imperative to look at your interest rates; the higher the rate, the more it ends up costing you down the road. To learn more about high-interest debt, you can visit Your Guide to Handling High Interest Debt | SoFi.
Retirement – How much can I spend annually in retirement?
Withdrawal Rate – Annual Withdrawal Amount / Total Portfolio Assets
Ex. if you have $1,000,000 in portfolio assets and you withdraw $40,000 per year, your withdrawal rate would be 4%.
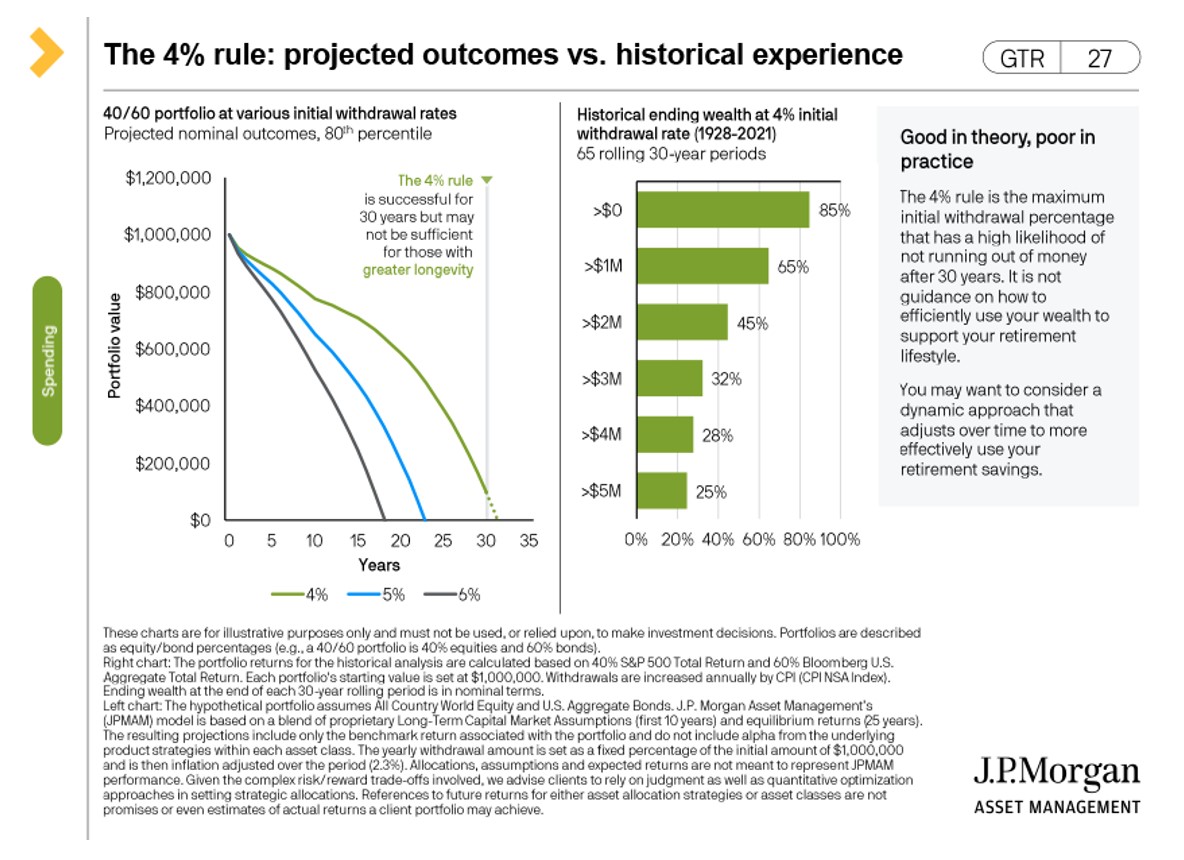
As you draw on your portfolio, you should aim for an annual withdrawal rate of no more than 4%. That is the industry rule of thumb. Withdrawing any more than that can start depleting your portfolio at a quicker rate than what is sustainable. The lower your withdrawal rate, the higher the probability of your long-term financial success. See the below chart from JP Morgan regarding withdrawal rate vs. longevity.
In order to calculate your Retirement Withdrawal Rate, you first need to determine your annual withdrawal amount. To do so, you will need to subtract the total of your annual expenses by your annual income (i.e., Pensions, Social Security, etc.). Whatever expenses are left over will equal how much you will need to withdraw from your portfolio assets.
Are You on the Right Track?
Curious if you are on the right track? Working through the above ratios should give you a better idea. If you are interested in learning more about how to stay on the fast track to financial freedom, contact us at [email protected] and we would be happy to setup a consultation with one of our advisors.
Schneider Downs Wealth Management Advisors, LP (SDWMA) is a registered investment adviser with the U.S. Securities and Exchange Commission (SEC). SDWMA provides fee-based investment management services and financial planning services, along with fee-based retirement advisory and consulting services. Material discussed is meant for informational purposes only, and it is not to be construed as investment, tax or legal advice. Please note that individual situations can vary. Therefore, this information should be relied upon when coordinated with individual professional advice. Registration with the SEC does not imply any level of skill or training.


